


Laser Damage Threshold Testing
This is Sections 14.4, 14.5, and 14.6 of the Laser Optics Resource Guide.
Laser damage testing is inherently destructive. The optic undergoing testing is exposed to a level of laser fluence and is then examined, typically with Nomarski-type differential interference contrast (DIC) microscopy. The fluence is then increased, and the exposure and examination steps are repeated. This process continues until damage is observed on the optic. While this is conceptually a simple process, there are several levels of complexity.
According to ISO 21254, any detectable change in an optic under test is considered “damage.” Different laser-induced damage threshold (LIDT) values may be produced depending on how the damage was evaluated, as not all tests use the same damage detection schemes and different operators might choose different signal-to-noise thresholds. It is important to realize that what ISO defines as “damage” does not necessarily imply performance degradation because it is application-dependent.
LIDT testing is specified by either a single or multi-shot test. A single-shot test, also known as a 1-on-1 test, involves one shot of laser radiation on at least 10 different sample sites across an optical component with varying laser fluence. The number of damaged sites over the total number of tested sites at that fluence determines the damage probability at a particular fluence. The damage probability is plotted as a function of fluence and the data is linearly extrapolated to find where the damage probability is 0%, which gives the LIDT value (Figure 1).
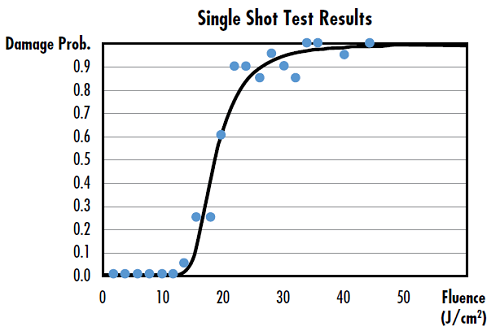
Figure 1: Sample data from a single shot test
A multi-shot, or S-on-1, test differs from a single-shot test in that it uses a series of laser shots, or pulses, per testing site as opposed to a single shot. The common number of shots per site, or S, is between 10 and 1000. Multi-shot tests provide a better prediction of the real-world performance of the optic, and allow LIDT testers to avoid a phenomenon called the infant mortality realm.1 When using between 1 and 10 shots per site, test results are non-deterministic and have high levels of statistical variation; this causes the range of shots per site to be known as the infant mortality realm. When S is greater than 10, the test results are more deterministic and predictable. Therefore, when around 100 shots per site are used, enough information can be gathered to predict the long-term performance of the optic. However, using more shots per site requires longer and more expensive LIDT testing.
Damage Detection Methods
Testing results may significantly differ depending on the detection method used to evaluate damage and there is currently no industry consensus on what method to use. While microscopy is the most common detection method used to identify damage, there are several other detection methods including scattered light diagnostics, plasma spark monitoring, and topography analysis.
Differential Interference Contrast Microscopy
Nomarski-type differential interference contrast (DIC) microscopy is the most common method used for laser damage detection following ISO 21254. DIC microscopy enhances image contrast in transparent samples by utilizing interferometry, allowing for viewing defects that would otherwise be difficult to identify.2 Once images of optic are taken from before and after testing, damage can be identified using human judgement or image processing techniques. Test results may vary widely when using human judgment due to subjective identification of damage by the operator, whereas image processing algorithms detect damage with no human error. However, even with image processing, false positives can result from vignetting, non-uniform illumination, or misalignment. In addition to confirming the presence of damage, DIC microscopy can also determine the dimensions of the defects.
Scattered Light Diagnostics
Another common detection method defined in ISO 21254 is scattered light diagnostics. This method uses light scattered from the target site to determine the existence and characteristics of laser-induced damage.2 In scattered light diagnostics, a probe beam (often a HeNe laser) illuminates the target site and any scattered signal difference significantly greater than the background noise implies the existence of damage on the optic (Figure 2). The probe beam itself is blocked before reaching the detector so that only scattered light is detected from damage sites.
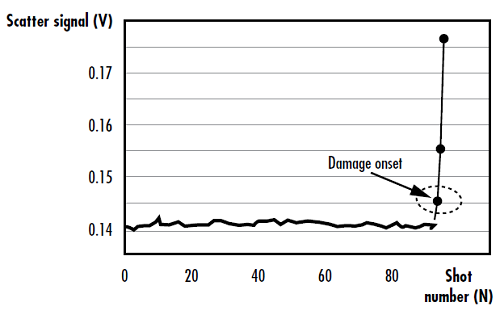
Figure 2: Drastic change in scatter signal after laser-induced damage onset
In a standard setup used for scattered light diagnostics, the larger the solid angle of the detector, the more sensitive the measurement (Figure 3). One disadvantage of this method is that it is heavily dependent on the amount of background noise. This dependency can be overcome by taking multiple measurements and averaging the results, increasing the gain of the detector, or filtering out the background noise.
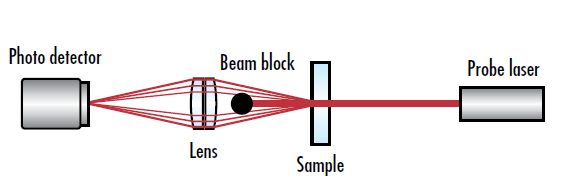
Figure 3: Schematic of a typical scattered light diagnostics setup for LIDT testing
Plasma Spark Monitoring
Plasma spark monitoring is another method used to detect laser damage. Laser-induced damage often results in plasma generation on the optical surface from non-resonant optical breakdown (called a plasma spark), which causes plasma scalds to form around the damage site. Identifying plasma sparks or scalds is a clear indication of damage to an optic.2 Plasma scalds have a relatively even surface area - this makes them difficult to detect through microscopy or scattered light diagnostics. However, the plasma spark itself can be detected during LIDT testing by using a collecting lens to focus light from any plasma sparks onto a detector (Figure 4). To detect LIDT, scattered light from the test laser is filtered out and the response time of the detector must be shorter than the duration of the plasma spark, which typically reaches its maximum value in about 100ns.
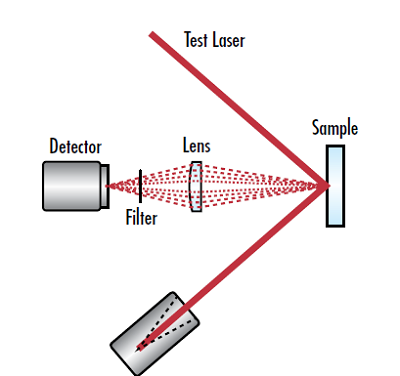
Figure 4: Schematic of a typical plasma spark monitoring setup for LIDT testing
Topography Analysis
Laser damage topography analysis involves generating a height map of laser-induced damage sites characterizing the size and depth of the damage.2 This method is not as commonly used as other detection methods as it tends to be more tedious and time consuming. However, valuable information for understanding the underlying mechanisms that caused the damage is provided through this method. Topography analysis can be performed using several different techniques including optical microscopy, atomic force microscopy (AFM), scanning electron microscopy (SEM), step profilers, and white light interferometry (WLI).
Different techniques are suited to detecting different types of laser-induced damage. Step profilers and AFM are ideal for precisely measuring shallow damage sites (approximately 200µm in diameter or less with a depth on the magnitude of one nanometer). Both of these techniques involve scanning a sample with a mechanical probe and generating a height map based on the deflection of the probe. AFM systems are able to achieve resolution on the order of fractions of a nanometer which is over 1000 times smaller than the optical diffraction limit for visible light.
SEM is more effective than step profilers and AFM at measuring deeper damage sites with an aspect ratio (ratio of width to depth) of around 1, including pits left behind from the deposition of multilayer coatings. SEM produces images by scanning a sample’s surface with a focused beam of electrons, which are able to penetrate much deeper than photons.3 Step profilers and AFM are not suitable for measuring deep damage sites because the sharp slopes make it difficult for contact probes to reach the bottom of the defect and produce accurate measurements.
Extremely deep damage sites that penetrate into the bulk material, or pinpoint structures, are much more difficult to measure because conventional topography analysis techniques only investigate the surface of the optic. In order to measure these damage sites, the bulk material must be exposed through cleaving or etching to allow one of the previously mentioned techniques to be used to make cross-sectional measurements at different depths. These cross-sections can then be combined into a complete 3D topography map.
Interpreting LIDT Test Results
The specified LIDT of an optic is determined by linearly extrapolating the test data to determine the laser fluence at which the probability of damage is zero. However, this is a linear fit to data that is not truly linear. This single value does not provide all necessary information and damage could still occur at or below the LIDT. Weibull and Burr distributions are continuous probability distributions that provide a much more accurate fit to LIDT data (Figure 5).
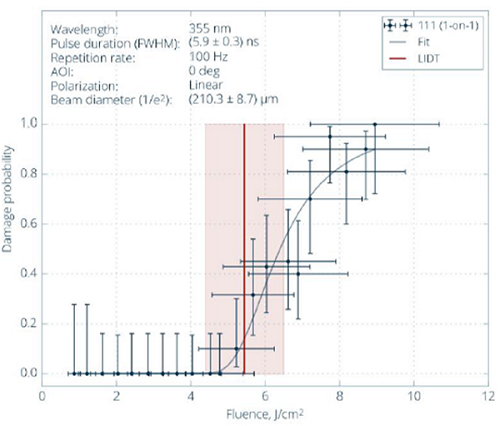
Figure 5: Real LIDT test data with the LIDT value shown by a red vertical line and a best fit 2-parameter Weibull distribution, showing that there is still some probability of damage below the LIDT value
In Figure 5, there is a non-zero probability of damage at a fluence around 5 J/cm2, even though this is below the specified LIDT value. The vertical error bars in damage probability are caused by the number of test sites and the horizontal error bars in fluence are caused by shot-to-shot variation of the test laser. Because no laser is perfect, there will always be some level of hotspots, or intensity fluctuations. This necessitates adding a factor of safety by choosing an optic with a LIDT higher than the laser’s use conditions. The safety factor required is heavily dependent on the application and type of laser, therefore no general safety factor works for all situations. Common industry practice is to use a safety factor of two of three. However, if the laser-induced damage is defect driven, there are statistical models that can be used to evaluate the damage probability at different safety factors (see our Importance of Beam Diameter on Laser Damage Threshold application note).
Developing Internal LIDT Testing Capabilities
Edmund Optics developed a robust LIDT testbed for internal testing of laser optics. Learn about the difficulties of developing such a system and Edmund's initial results in our SPIE conference proceedings below.
Learn More
References
- Johnson, Lawrence A. Laser Diode Burn-In and Reliability Testing. ILX Lightwave, 2006.
- Ristau, Detlev. Laser-Induced Damage in Optical Materials. CRC Press, 2016.
- Kanaya, K. “Penetration and Energy-Loss Theory of Electrons in Solid Targets.” J. Phys. D: Appl. Phys. 5, 43, 1972.
More Resources
- Understanding and Specifying LIDT of Laser Components Application Note
- Laser Damage Threshold Scaling Calculator
- Uncertainty in LIDT Specifications Application Note
- Different Types of LIDT Specifications Application Note
- Bulk Laser Damage in Glass Application Note
- Importance of Beam Diameter on Laser Damage Threshold Application Note
- LIDT for Ultrafast Lasers Application Note
- Why Laser Damage Testing is Critical for UV Laser Applications Application Note
- A Guide to (Not Over) Specifying Losses in Laser Optics Application Note
- Metrology at Edmund Optics: Measuring as a Key Component of Manufacturing Video
- Metrology for Laser Optics Application Note
- Key Parameters of a Laser System Application Note
- Laser Optics Lab Video Series


or view regional numbers
QUOTE TOOL
enter stock numbers to begin
Copyright 2024, Edmund Optics Singapore Pte. Ltd, 18 Woodlands Loop #04-00, Singapore 738100
California Consumer Privacy Acts (CCPA): Do Not Sell or Share My Personal Information
California Transparency in Supply Chains Act
This content may include material that has been generated or modified using artificial intelligence (AI).
The FUTURE Depends On Optics®